Google Chart 
A wraper for google chart
Installation 
The preferred way to install this extension is through composer.
Either run
php composer.phar require scotthuangzl/yii2-google-chart "dev-master"
or add
"scotthuangzl/yii2-google-chart": "dev-master"
to the require section of your composer.json file.
Please check CHANGE.md to ensure it is at V0.2 after installation. thanks.
Sample Result 


Usage 
Once the extension is installed, simply use it in your code by : Btw, it may be not work in China in case you cannot access https://www.google.com/jsapi Thanks.
You also can refer to https://developers.google.com/chart/interactive/docs/quick_start
<div class="col-sm-5">
            <?php
            use scotthuangzl\googlechart\GoogleChart;

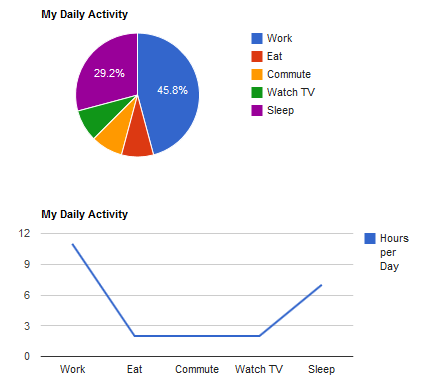
            echo GoogleChart::widget(array('visualization' => 'PieChart',
                'data' => array(
                    array('Task', 'Hours per Day'),
                    array('Work', 11),
                    array('Eat', 2),
                    array('Commute', 2),
                    array('Watch TV', 2),
                    array('Sleep', 7)
                ),
                'options' => array('title' => 'My Daily Activity')));
            echo GoogleChart::widget(array('visualization' => 'LineChart',
                'data' => array(
                    array('Task', 'Hours per Day'),
                    array('Work', 11),
                    array('Eat', 2),
                    array('Commute', 2),
                    array('Watch TV', 2),
                    array('Sleep', 7)
                ),
                'options' => array('title' => 'My Daily Activity')));

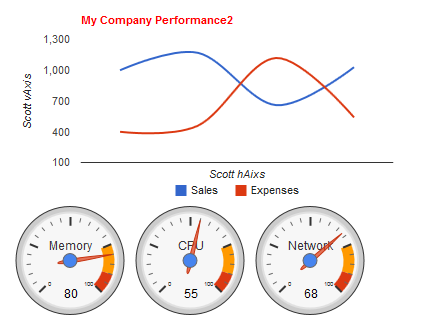
            echo GoogleChart::widget(array('visualization' => 'LineChart',
                'data' => array(
                    array('Year', 'Sales', 'Expenses'),
                    array('2004', 1000, 400),
                    array('2005', 1170, 460),
                    array('2006', 660, 1120),
                    array('2007', 1030, 540),
                ),
                'options' => array(
                    'title' => 'My Company Performance2',
                    'titleTextStyle' => array('color' => '#FF0000'),
                    'vAxis' => array(
                        'title' => 'Scott vAxis',
                        'gridlines' => array(
                            'color' => 'transparent'  //set grid line transparent
                        )),
                    'hAxis' => array('title' => 'Scott hAixs'),
                    'curveType' => 'function', //smooth curve or not
                    'legend' => array('position' => 'bottom'),
                )));
            echo GoogleChart::widget( array('visualization' => 'Gauge', 'packages' => 'gauge',
                'data' => array(
                    array('Label', 'Value'),
                    array('Memory', 80),
                    array('CPU', 55),
                    array('Network', 68),
                ),
                'options' => array(
                    'width' => 400,
                    'height' => 120,
                    'redFrom' => 90,
                    'redTo' => 100,
                    'yellowFrom' => 75,
                    'yellowTo' => 90,
                    'minorTicks' => 5
                )
            ));
            echo GoogleChart::widget( array('visualization' => 'Map',
                'packages'=>'map',//default is corechart
                'loadVersion'=>1,//default is 1.  As for Calendar, you need change to 1.1
                'data' => array(
                    ['Country', 'Population'],
                    ['China', 'China: 1,363,800,000'],
                    ['India', 'India: 1,242,620,000'],
                    ['US', 'US: 317,842,000'],
                    ['Indonesia', 'Indonesia: 247,424,598'],
                    ['Brazil', 'Brazil: 201,032,714'],
                    ['Pakistan', 'Pakistan: 186,134,000'],
                    ['Nigeria', 'Nigeria: 173,615,000'],
                    ['Bangladesh', 'Bangladesh: 152,518,015'],
                    ['Russia', 'Russia: 146,019,512'],
                    ['Japan', 'Japan: 127,120,000']
                ),
                'options' => array('title' => 'My Daily Activity',
                    'showTip'=>true,
                )));
            ?>
        </div>
Google Chart in PDF
Hi!
First I want to thank you for your work !!
I need to create a pdf with some Google Charts but this not render the image.
I have modified the the module to render as an PNG image and it works only when render the view as HTML but not in PDF
public function registerClientScript2($id)
    {

        $jsData = Json::encode($this->data);
        $jsOptions = Json::encode($this->options);

        $script = '
			google.setOnLoadCallback(drawChart' . $id . ');
			var ' . $id . '=null;
			function drawChart' . $id . '() {
				var data = google.visualization.arrayToDataTable(' . $jsData . ');

				' . $this->scriptAfterArrayToDataTable . '

				var options = ' . $jsOptions . ';

				var chart_div = document.getElementById("' . $this->containerId . '");
				' . $id . ' = new google.visualization.' . $this->visualization . '(chart_div);
				' . 'google.visualization.events.addListener(' . $id . ', \'ready\', function () {
							chart_div.innerHTML = \'<img src="\'+' . $id . '.getImageURI()+\'">\';
					});
				' . $id . '.draw(data, options);
			}';

        $view = $this->getView();
        $view->registerJsFile('https://www.google.com/jsapi',['position' => View::POS_HEAD]);
        $view->registerJs('google.load("visualization", "' . $this->loadVersion . '", {packages:["' . $this->packages . '"]});', View::POS_HEAD, __CLASS__ . '#' . $id);
        $view->registerJs($script, View::POS_HEAD, $id);
    }
also, i tried to include the
<img src="data:image/png;base64,iVBORw0KGg.....">tag in the view and this work in HTML and PDF too.
I am also open to alternative or different ways to generate a PDF with Goochar Chart
Coogle Chart Native
Google Chart as PNG
PDF render
PDF with tag inline and Google Chart generated
Thank you!!
Other Data Types or Javascript Expressions
Thanks for your work on this. Getting the libraries to load in the right order was driving me crazy.
For anyone who, like me, needs to use things like dates in their charts, yii\web\JsExpression is extremely helpful. You can put something like the following directly into your data array, and the internal JSON encoding will work properly on it.
new JsExpression("new Date('2015-07-06')")Display Values
Is there a way to display the column value directly on the chart for printout purposes?
How to change bar colors on graph. I've used colors option but it change only first colors from array. I want to change each bar color but unable to set it. Please help.
<?=
GoogleChart::widget(['visualization' => 'BarChart', 'data' => $data, 'options' => [ 'title' => 'Project Description', 'legend' => 'none', 'hAxis' => ['title' => 'Total Number Of Projects: ' . $totalProjects], 'height' => $cHeight, 'colors'=> ['#e0440e', '#e6693e', '#ec8f6e', '#f3b49f', '#f6c7b6','#e0440e', '#e6693e', '#ec8f6e', '#f3b49f', '#f6c7b6','#e0440e', '#e6693e', '#ec8f6e', '#f3b49f', '#f6c7b6'] ], ]); ?>If you have any questions, please ask in the forum instead.
Signup or Login in order to comment.