A widget wrap for google chart.
Scott Huang(zhiliang)'s first widget:)
Requirements 
requirements of using this extension (e.g. Yii 1.1 or above)
Usage 
<div class="row">
    <div class="span6" >
        <?php
//very useful google chart
        $this->widget('ext.Hzl.google.HzlVisualizationChart', array('visualization' => 'PieChart',
            'data' => array(
                array('Task', 'Hours per Day'),
                array('Work', 11),
                array('Eat', 2),
                array('Commute', 2),
                array('Watch TV', 2),
                array('Sleep', 7)
            ),
            'options' => array('title' => 'My Daily Activity')));

        $this->widget('ext.Hzl.google.HzlVisualizationChart', array('visualization' => 'LineChart',
            'data' => array(
                array('Task', 'Hours per Day'),
                array('Work', 11),
                array('Eat', 2),
                array('Commute', 2),
                array('Watch TV', 2),
                array('Sleep', 7)
            ),
            'options' => array('title' => 'My Daily Activity')));
        ?>

    </div>
</div>


<div class="row">
    <div class="span6" >
        <?php
        $this->widget('ext.Hzl.google.HzlVisualizationChart', array('visualization' => 'Gauge', 'packages' => 'gauge',
            'data' => array(
                array('Label', 'Value'),
                array('Memory', 80),
                array('CPU', 55),
                array('Network', 68),
            ),
            'options' => array(
                'width' => 400,
                'height' => 120,
                'redFrom' => 90,
                'redTo' => 100,
                'yellowFrom' => 75,
                'yellowTo' => 90,
                'minorTicks' => 5
            )
        ));
        ?>
    </div>
</div>

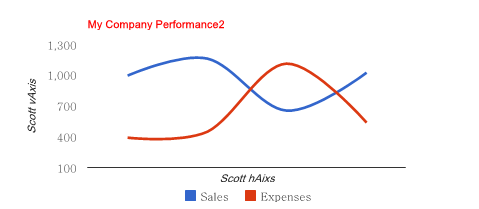
//New Example:
$this->widget('ext.Hzl.google.HzlVisualizationChart', array('visualization' => 'LineChart',
            'data' => array(
                array('Year', 'Sales', 'Expenses'),
                array('2004', 1000, 400),
                array('2005', 1170, 460),
                array('2006', 660, 1120),
                array('2007', 1030, 540),
            ),
            'options' => array(
                'title' => 'My Company Performance2',
                'titleTextStyle' => array('color' => '#FF0000'),
                'vAxis' => array(
                    'title' => 'Scott vAxis',
                    'gridlines' => array(
                        'color' => 'transparent'  //set grid line transparent
                    )),
                'hAxis' => array('title' => 'Scott hAixs'),
                'curveType' => 'function', //smooth curve or not
                'legend' => array('position' => 'bottom'),
        )));
Result 

Jan 5 2014: 2nd example for hAixs and vAixs

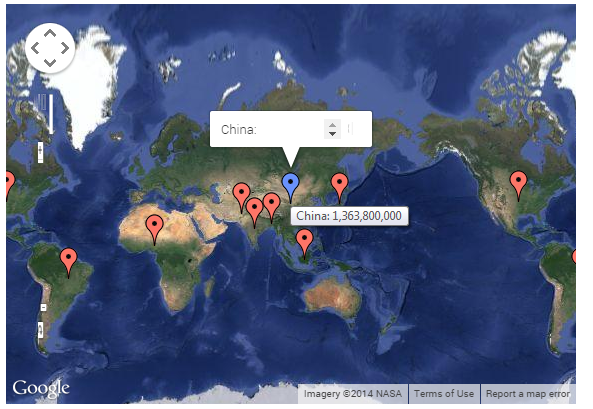
Sep 16,2014: New Sample for Map
<div class="row">
    <div class="span6" >
        <?php
//very useful google chart

        $this->widget('ext.Hzl.google.HzlVisualizationChart', array('visualization' => 'Map',
            'packages'=>'map',//default is corechart
            'loadVersion'=>1,//default is 1.  As for Calendar, you need change to 1.1
            'data' => array(
       ['Country', 'Population'],
        ['China', 'China: 1,363,800,000'],
        ['India', 'India: 1,242,620,000'],
        ['US', 'US: 317,842,000'],
        ['Indonesia', 'Indonesia: 247,424,598'],
        ['Brazil', 'Brazil: 201,032,714'],
        ['Pakistan', 'Pakistan: 186,134,000'],
        ['Nigeria', 'Nigeria: 173,615,000'],
        ['Bangladesh', 'Bangladesh: 152,518,015'],
        ['Russia', 'Russia: 146,019,512'],
        ['Japan', 'Japan: 127,120,000']
            ),
            'options' => array('title' => 'My Daily Activity',
                'showTip'=>true,
                )));
        ?>

    </div>
</div>

Finally successfully attach zip and png picture into this page:)
Enjoy the google chart, thanks.
hAxis and vAxis options are not working why?
please give an example to work with hAxis and vAxis
To @bhawin : The examples for you:)
$this->widget('ext.Hzl.google.HzlVisualizationChart', array('visualization' => 'LineChart', 'data' => array( array('Year', 'Sales', 'Expenses'), array('2004', 1000, 400), array('2005', 1170, 460), array('2006', 660, 1120), array('2007', 1030, 540), ), 'options' => array( 'title' => 'My Company Performance2', 'titleTextStyle' => array('color' => '#FF0000'), 'vAxis' => array( 'title' => 'Scott vAxis', 'gridlines' => array( 'color' => 'transparent' //set grid line transparent )), 'hAxis' => array('title' => 'Scott hAixs'), 'curveType' => 'function', //smooth curve or not 'legend' => array('position' => 'bottom'), )));how to format data to provide for google pie chart
My data is in this format please provide an example that how i can provide data to the pie chart
Array ( [0] => Array ( [projectname] => Project3 [total_requests] => 1 ) [1] => Array ( [projectname] => RTI [total_requests] => 1 ) [2] => Array ( [projectname] => STAEP [total_requests] => 3 ) )To: Amjad Khan
To: Amjad Khan
$this->widget('ext.Hzl.google.HzlVisualizationChart', array('visualization' => 'PieChart', 'data' => array( array('projectname', 'total_requests'), array('Project3', 1), array('RTI', 1), array('STAEP', 3), ), 'options' => array('title' => Amjad Khan Pie')));My Data is dynamic
Basically i asked you how can i change this dynamic data into the respective format u have given in your examples
I try this solution but it will not work i convert the array into string but it does not work
$mystring=" array(array('projectname', 'total_requests'),";
foreach($result as $value)
{
    $mystring.= 'array('.'\''.$value['projectname'].'\''.' , '.$value['total_requests']."),";
}
 $mystring.=')';

i got following result

array(array('projectname', 'total_requests'),array('Project3' , 1),array('RTI' , 1),array('STAEP' , 3),)

and then i past above result infront of "data" it will work,  but when i write $mystring infront of "data" it will not work

   $this->widget('ext.Hzl.google.HzlVisualizationChart', array('visualization' => 'PieChart',
    'data' =>$mystring
    ));
My data is dynamic and it can change so please give me suggestion or solution in case of dynamic data coming form database
To: Amjad Khan
You supprise me to be frankly:)
Below is the code. We need array not string. Thanks.
$pieData = array( array('projectname', 'total_requests'), array('Project3', 1), array('RTI', 1), array('STAEP', 3), ); $this->widget('ext.Hzl.google.HzlVisualizationChart', array('visualization' => 'PieChart', 'data' => $pieData, 'options' => array('title' => 'My Daily Activity')));chose between different types of charts
Is it possible for a user to chose between different types of charts?
Is there such an option?
@iridescent
Please write your own code to wrap the different charts before I have time to do it. All types can find from google chart gallery(in resource session). Thanks.
Dates in x axis
If you have dates in the x axis for a Google chart, then the form of the element in the json expected by Google is
[javascript]
new Date(1789, 3, 29)
(People with more knowledge than me will, I think, tell you that this is not really valid json because the js date object isn't one of the primitive datatypes json supports but it's what Google Charts wants so I guess we have to live with it.)
Using the extension as it stands it's not possible to output the json in this form because the element ends up being in double quotes ie "new Date(1789, 3, 29)" and therefore being treated as a string by Google Charts.
The only workaround I've managed is described here but modified to cope with double quotes rather than single. This does work but it's not very nice and requires either sub-classing the extension or modifying the registerClientScript() function.
If there's another, much nicer way of doing this I would be very happy to hear about it.
Dynamic chart data
Working example for dynamic data, Amjan it expect an array not an string ;)
$myArray = array();
	array_push($myArray, array('projectname', 'total_requests'));

	foreach($this->crops as $value) // or whatever loop structure
	{
	    array_push($myArray, array($value->TITLE, count($value->BIDS)));
	}

	//print_r($myArray);

	$this->widget('ext.Hzl.google.HzlVisualizationChart',
		array('visualization' => 'PieChart',
	    		'data' => $myArray)
	    );
Enjoy :P
For dynamical numbers
I have that code:
<?php $array_data = array(); array_push($array_data, array('Task', 'Stats')); foreach ( $this->getData() as $dane){ $stat_views = intval($dane->views); array_push($array_data, array($dane->date, $stat_views)); } //print_r($array_data); ?> <?php $this->widget('ext.googlehart.HzlVisualizationChart', array('visualization' => 'LineChart', 'data' => $array_data, 'options' => array('title' => 'Stats:'))); ?>Upgrade to version 0.2
Add loadVersion parameter. Default is 1
As for Calendar, you need change to 1.1. Please check out google chart gallery from here .
And provide Map sample.
YII google charts and ajax support
Hello,
Can someone please share a code snippet to use ajax with this YII plugin.
I tried 'ajax'
and I get a error
Property "HzlVisualizationChart.ajax" is not defined.
working model of ajax with googlechart
@ctippur this works for me:
echo TbHtml::ajaxButton(
        'Refresh',
        array('statistics/processData'),
        array(
	        'dataType'=>'json',
	        'type'=>'post',
			'url' => CController::createUrl('statistics/processData'),
			'data' => 'js:{"status": $("#inputStatus").val(), "year": $("#inputYear").val() }',
			'success'=>"js:function(data){

				if (data.length>1) {
					if ($('#inputChart').val()=='B')
		        		var chart = new google.visualization.BarChart(document.getElementById('chart_div'));
		        	else
		        		var chart = new google.visualization.PieChart(document.getElementById('chart_div'));

		        	var data = google.visualization.arrayToDataTable(data);

					var options = {
						title: '',
						legend: 'left',
						is3D: true,
					};

		        	chart.draw(data, options);
		        }
		        else {
		        	$('#chart_div').html('no data');
		        }

			}",
        ),
        array(
	        'id'=>'someID',
	        'color'=>TbHtml::BUTTON_COLOR_DEFAULT,
	        'size'=>TbHtml::BUTTON_SIZE_DEFAULT,
        )
    );
and this is the action in the controller:
public function actionProcessData() {
		$year = date('Y');
		if (isset($_POST['year']))
			$year = $_POST['year'];

		$status = 0;
		if (isset($_POST['status']))
			$status = $_POST['status'];

		$sql= "
			SELECT n.Nationality, COUNT( a.ID ) AS total
			FROM (applicant a, nationality n)
			LEFT JOIN applicant_status apps ON (apps.ApplicantID = a.ID)
			WHERE (a.NationalityID = n.ID) AND ((YEAR(apps.StartedOn)=".$year.") AND (apps.StatusID=".$status."))
			GROUP BY a.NationalityID
			ORDER BY n.Nationality";

		$connection=Yii::app()->db;
		$command=$connection->createCommand($sql);
		$dataReader=$command->query();

		$data = array();
		$data[] = array('Nationality', 'Quantity', array('role'=>'style'));

		while(($row=$dataReader->read())!==false) {
			$data[] = array($row['Nationality']." (".$row['total'].")", intval($row['total']), 'stroke-color: #0050FF; stroke-opacity: 0.6; stroke-width: 2; fill-color: #76A7FA; fill-opacity: 0.2');
		}

		echo json_encode($data);
	}
hth
Thanks for the response
lgastmans -
Thanks for the response. I am able to render google chart now. There were some other wrinkles.
When google chart gets overlaid on top of YII layout, the chart is all over the place. The table only shows partial data.
I have not played around much with css or responsive layouts.
Any pointers on how to make it fit the YII default layout?
doubts extension google Chart with the colors and the ComboChart
in the editor I have google chart
google.setOnLoadCallback(drawChart);
function drawChart() {
var data = google.visualization.arrayToDataTable([
['Year', 'Sales',{ role: 'style' }, 'Expenses',{ role: 'style' },'new'],
['2004', 1000,'red' , 400,'#b87333',200],
['2005', 1170, 'red' , 460,'#b87333',200],
['2006', 660, 'red' , 1120,'#b87333',200],
['2007', 1030, 'red' , 540,'#b87333',200]
]);

var options = {
title: 'Company Performance',
vAxis: {title: 'Year', titleTextStyle: {color: 'red'}}
};

var chart = new google.visualization.BarChart(document.getElementById('chart_div'));

chart.draw(data, options);
}
adapt it to the google chart extension
<div class="row" >
<div class="span6" >
<?php
//very useful google chart
$this->widget('ext.Hzl.google.HzlVisualizationChart', array('visualization' => 'BarChart',
'data' => array(
array('Secretarias', 'Hallazgos'," { role: 'style' }", 'Proceso', 'Vencidos'),
array('Interior', 11,"#b87333",8,4),
array('Setic', 2,"#b87333",8,4),
array('Infraestructura', 2,"#b87333",8,4),
array('Hacienda', 2,"#b87333",8,4),
array('Agricultura', 7,"#b87333",8,4)
),
'options' => array(
'title' => 'por secretarias',
),

));?>

</div>
</div>
but I get the error "All series on a given axis must be of the same data type" check and think they are good data type, help please
doubts extension google Chart with the colors and the ComboChart
@javprieto: change " { role: 'style' }" to array('role'=>'style')
this works:
$this->widget('ext.Hzl.google.HzlVisualizationChart', array('visualization' => 'BarChart', 'data' => array( array('Secretarias', 'Hallazgos', array('role'=>'style'), 'Proceso', 'Vencidos'), array('Interior', 11,"#b87333",8,4), array('Setic', 2,"#b87333",8,4), array('Infraestructura', 2,"#b87333",8,4), array('Hacienda', 2,"#b87333",8,4), array('Agricultura', 7,"#b87333",8,4) ), 'options' => array( 'title' => 'por secretarias', ), ));thanks for the reply, now I want to use the ComboChart
thanks for the reply, now I want to use the ComboChart, but not how to adjust the portion of options
var options = {
    title : 'Monthly Coffee Production by Country',
    vAxis: {title: "Cups"},
    hAxis: {title: "Month"},
    seriesType: "bars",
    series: {5: {type: "line"}} // this part please
  };
this part is so 'series'=> array('3'=> array('type'=>'line'))
chart in offline mode
Hi, I have implemented this google analysis in my yii App. but the problem is chart will only showing if the internet connection is up. i am developing a site in localhost so i need to show this chart without connecting to the internet. how can i do that ?
charts in offline mode is not allowed
From Google's Charts FAQ:
Can I use charts offline?
Your users' computers must have access to https://www.google.com/jsapi in order to use the interactive features of Google Charts. This is because the visualization libraries that your page requires are loaded dynamically before you use them. The code for loading the appropriate library is part of the included jsapi script, and is called when you invoke the google.load() method. <b>Our terms of service do not allow you to download the google.load or google.visualization code to use offline</b>.If you have any questions, please ask in the forum instead.
Signup or Login in order to comment.