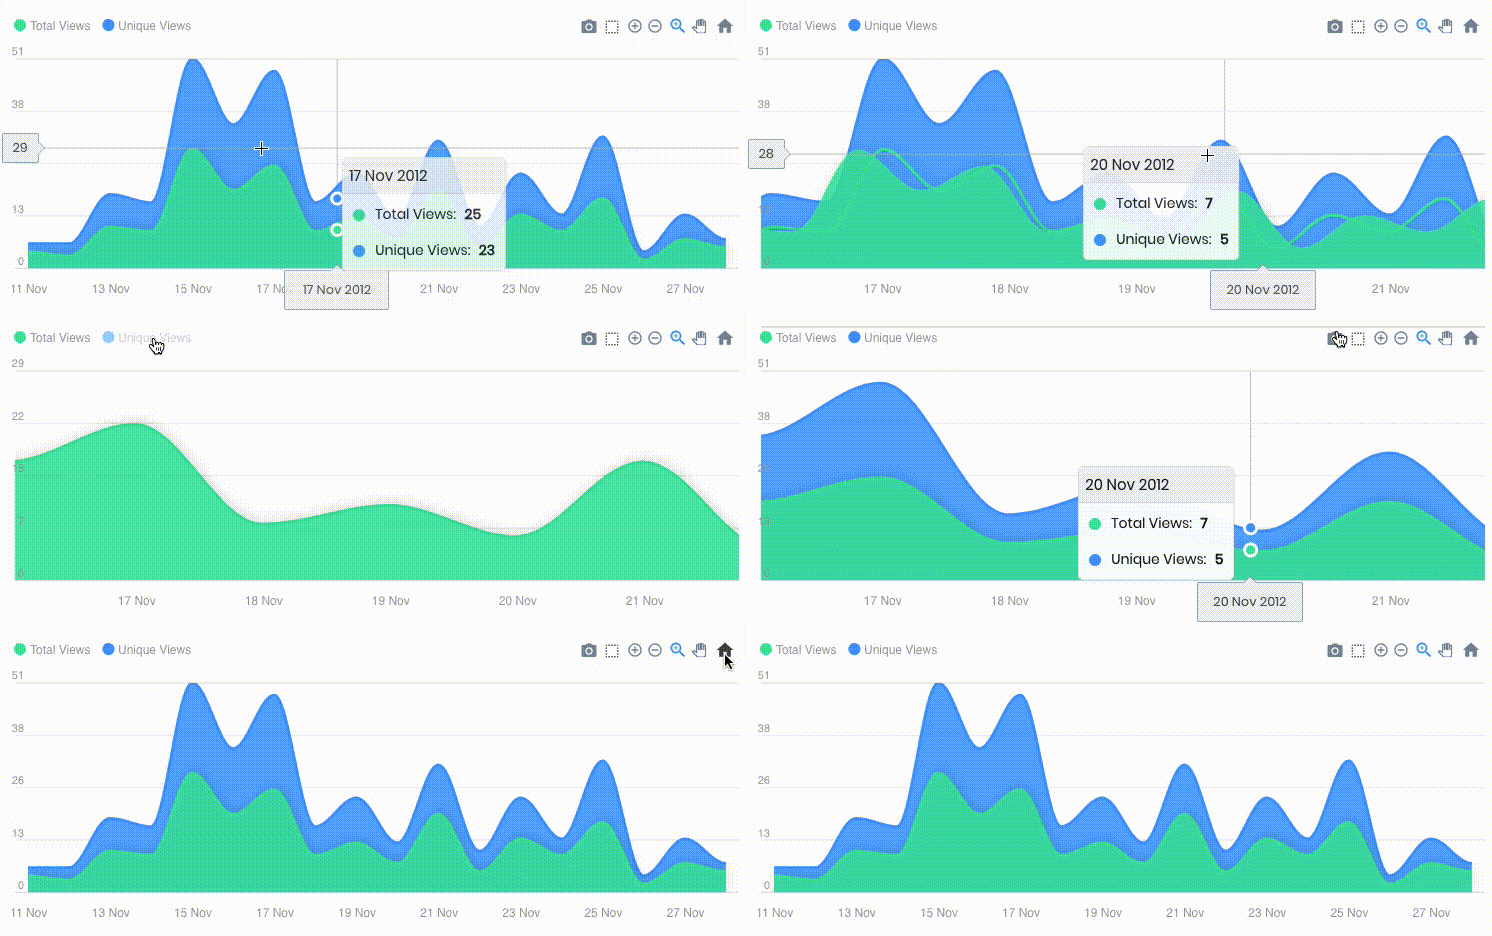
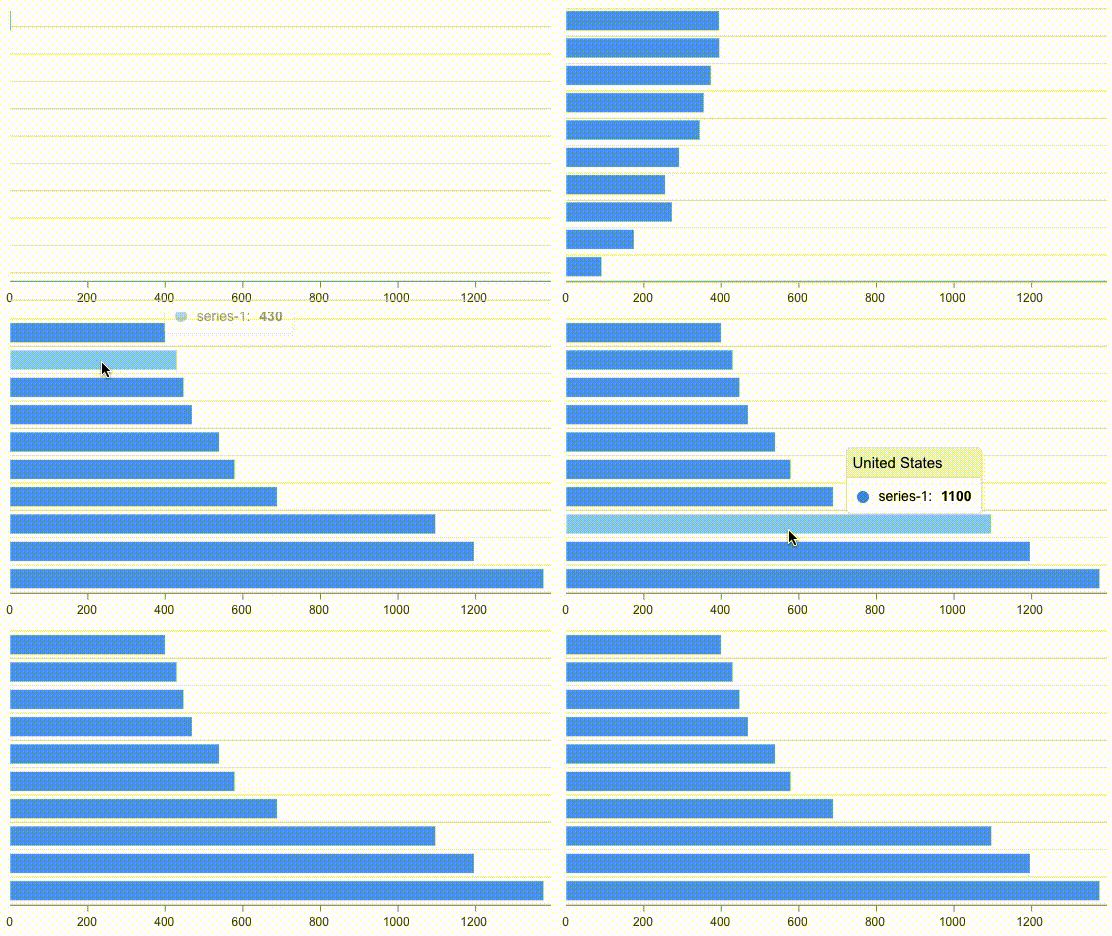
Yii2 charts widget 
Yii2 charts widget - wrapper for the ApexCharts.js.


For more examples see ApexCharts.js demos
Installation 
Just run:
composer require onmotion/yii2-widget-apexcharts
or add
"onmotion/yii2-widget-apexcharts": "*"
to the require section of your composer.json file.
Usage 
Add echo \onmotion\apexcharts\ApexchartsWidget::widget([])
with necessary options in the view file.
Options 
| Option | type | default | description |
|---|---|---|---|
| timeout | int | 500 | Timeout before widget appearance |
| type | string | area | Chart type. More |
| width | string | 100% | Chart width |
| height | string | 350 | Chart height |
| chartOptions | array | detail | |
| series | array | detail |
Examples 
$series = [
    [
        'name' => 'Entity 1',
        'data' => [
            ['2018-10-04', 4.66],
            ['2018-10-05', 5.0],
        ],
    ],
    [
        'name' => 'Entity 2',
        'data' => [
            ['2018-10-04', 3.88],
            ['2018-10-05', 3.77],
        ],
    ],
    [
        'name' => 'Entity 3',
        'data' => [
            ['2018-10-04', 4.40],
            ['2018-10-05', 5.0],
        ],
    ],
    [
        'name' => 'Entity 4',
        'data' => [
            ['2018-10-04', 4.5],
            ['2018-10-05', 4.18],
        ],
    ],
];

echo \onmotion\apexcharts\ApexchartsWidget::widget([
    'type' => 'bar', // default area
    'height' => '400', // default 350
    'width' => '500', // default 100%
    'chartOptions' => [
        'chart' => [
            'toolbar' => [
                'show' => true,
                'autoSelected' => 'zoom'
            ],
        ],
        'xaxis' => [
            'type' => 'datetime',
            // 'categories' => $categories,
        ],
        'plotOptions' => [
            'bar' => [
                'horizontal' => false,
                'endingShape' => 'rounded'
            ],
        ],
        'dataLabels' => [
            'enabled' => false
        ],
        'stroke' => [
            'show' => true,
            'colors' => ['transparent']
        ],
        'legend' => [
            'verticalAlign' => 'bottom',
            'horizontalAlign' => 'left',
        ],
    ],
    'series' => $series
]);


If you have any questions, please ask in the forum instead.
Signup or Login in order to comment.