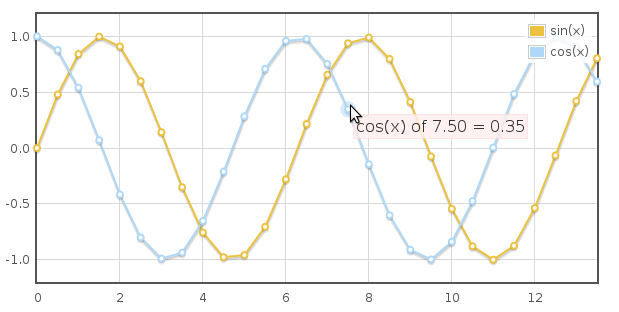
This extension encapsulates the jQuery flot graph library see flot

Flot says:
Flot is a pure Javascript plotting library for jQuery. It produces graphical plots of arbitrary datasets on-the-fly client-side.
The focus is on simple usage (all settings are optional), attractive looks and interactive features like zooming and mouse tracking.
The plugin works with Internet Explorer 6/7/8, Firefox 2.x+, Safari 3.0+, Opera 9.5+ and Konqueror 4.x+ with the HTML canvas tag (the excanvas Javascript emulation helper is used for IE).
Documentation 
Requirements 
- Yii 1.1 or above (not tested on 1.0 but might work)
Installation 
- Extract the release file under
protected/extensions - The API doc is included in assets
- the pie plugin is documented in assets/flotpie.html
Usage 
See the following code example:
<!--
example view for flot graphs
-->

<h1>Flot</h1>
<?php
// lines and bars in same graph

$this->widget('application.extensions.EFlot.EFlotGraphWidget',
	array(
		'data'=>array(
			array(
				'label'=> 'line',
				'data'=>array(
					array(1,1),
					array(2,7),
					array(3,12),
					array(4,32),
					array(5,62),
					array(6,89),
				),
				'lines'=>array('show'=>true),
				'points'=>array('show'=>true),
			),
			array(
				'label'=> 'bars',
				'data'=>array(
					array(1,12),
					array(2,16),
					array(3,89),
					array(4,44),
					array(5,38),
				),
				'bars'=>array('show'=>true),
			),
		),
		'options'=>array(
				'legend'=>array(
					'position'=>'nw',
					'show'=>true,
					'margin'=>10,
					'backgroundOpacity'=> 0.5
					),
		),
		'htmlOptions'=>array(
			   'style'=>'width:400px;height:400px;'
		)
	)
);
?>

//Pie chart example

<?php
$format_func = <<<EOD
js:function(label, series){
	return '<div style="font-size:8pt;text-align:center;padding:2px;color:white;">'+label+'<br/>'+Math.round(series.percent)+'%</div>';}
EOD;
$this->widget('application.extensions.EFlot.EFlotGraphWidget',
	array(
		'data'=>array(
			array('label'=>'cows', 'data'=>20),
			array('label'=>'sheep', 'data'=>20),
			array('label'=>'chickens', 'data'=>30),
		),
		'options'=>array(
			'series'=> array('pie'=>array(
				'show'=>true,
				'radius'=> 3/4,
				'formatter'=> $format_func,
				),
			),
			'legend'=> array('show'=>false),
		),
		'htmlOptions'=>array('style'=>'width:400px;height:400px;')
	)
);
?>
Change Log 
May 4, 2010 
- Initial release.
May 5, 2010 
- V1.1
- Rezipped to create EFlot dir under extensions
- Cleaned up case errors in includes (thats what happens if you develop in Windows..)
- t.b.d. auto include of other js-plugins when specified in data or options
 mbetel
How Do I
add this plugin to the extension?
http://github.com/ubermajestix/flot-plugins
nice implmenetation
great documentation.
path under extension
Sorry about that.. I'll rezip the package so it will create a dir EFlot under extensions.
very nice extension, though
<Yii::import('application.extensions.EFlot.EFlotWidget');
>Yii::import('application.extensions.Eflot.EFlotWidget');
sorry
I should say:
<Yii::import('application.extensions.Eflot.EFlotWidget');
>Yii::import('application.extensions.Eflot.EFlotWidget');
modification of the source needed???
It is not clear that we should make a directory of "Eflot" or "EFlot" under protected/extensions.
This package did not work until I made a directory of "Eflot" and made a modification as follows.
EFlotGraphWidget.php:
<Yii::import('application.extensions.EFlot.EFlotWidget');
>Yii::import('application.extensions.Eflot.EFlotWidget');
folder naming
definitly there is something wrong with the folder naming.. i changed the asset importpath:
-           $basePath=Yii::getPathOfAlias('application.extensions.Eflot.assets');
+           $basePath = dirname(__FILE__).DIRECTORY_SEPARATOR.'assets';
so i use EFlot now as foldername
Issue with TimeStamp xaxis
Hey,
I'm trying to use a timestamped axis and it's not working (i.e. not generating dates on the x-axis, just the timestamp miliseconds). This might stem from the lack of double-quotes that gets generated for the "time" and "timeformat" options.
Here is my code:
$this->widget('application.extensions.EFlot.EFlotGraphWidget',
    array(
        'data'=>array(
            array(
                'label'=> 'line',
                'data'=>$model->getPacingChartData(),
                'lines'=>array('show'=>true),
                'points'=>array('show'=>true),
                'xaxis'=>array(
                    'mode'=>'time',
                    'timeformat'=>'%y/%m/%d'
                ),
            ),
        ),
        'options'=>array(
                'legend'=>array(
                    'position'=>'nw',
                    'show'=>true,
                    'margin'=>10,
                    'backgroundOpacity'=> 0.5
                    ),
        ),
        'htmlOptions'=>array(
               'style'=>'width:600px;height:400px;'
        )
    )
);
and the script that gets generated on the page looks like:
<script type="text/javascript"> /*<![CDATA[*/ jQuery(function($) { $.plot($('#yw1'), [{'label':'line', 'data':[[1296518400000.,6855],[1296604800000.,6833],[1296691200000.,6707],[1296777600000.,6575],[1296864000000.,6588],[1296950400000.,6613],[1297036800000.,6433],[1297123200000.,6578],[1297209600000.,6331],[1297296000000.,6297],[1297382400000.,6217],[1297468800000.,6322],[1297555200000.,6085],[1297641600000.,6059],[1297728000000.,6029],[1297814400000.,5902],[1297900800000.,5871],[1297987200000.,5787],[1298073600000.,5670],[1298160000000.,5581],[1298246400000.,5516],[1298332800000.,5329],[1298419200000.,5270],[1298505600000.,5109],[1298592000000.,4723],[1298678400000.,4527],[1298764800000.,4150],[1298851200000.,3139]], 'lines':{'show':true}, 'points':{'show':true}, 'xaxis':{'mode':'time','timeformat':'%y/%m/%d'}}], {'legend':{'position':'nw','show':true,'margin':10,'backgroundOpacity':0.5}}); jQuery('body').undelegate('#yt0','click').delegate('#yt0','click',function(){if(confirm('Are you sure you want to delete this item?')) {jQuery.yii.submitForm(this,'/analytics/index.php?r=campaign/delete&id=256',{});return false;} else return false;}); }); /*]]>*/ </script>Update?
Just wondering if there's any plan to update this so that it incorporates the 0.7 release of flot?
Not being the world's greatest expert with either yii or flot it took me a while to realise that the reason one of the options I was specifying wasn't working was because I was reading the documentation for flot 0.7 and using flot 0.6. (I got round it eventually by just downloading flot 0.7 and overwriting the contents of the Eflot/assets directory. The 'yaxis'=>array('show'=>false) option then started working but obviously this might not work for all version related issues.)
Updating EFlot
Hi all,
Mostly I develop an extension when the need arises in one of my own projects. If it works for me then I'm happy, and when I think someone else might benefit I upload it.
However, I'll look into updating Eflot, taking heed of the comments here when I have time, which soonest will be next weekend.
how to modify the label,x axis, and y?
Nice extension..it sure does gave me a clear light in the dark.
but may I ask you something?
if I would like to modify the label name,
X line data becomes month (ex:'Jan','Feb',etc),
and Y data becomes Year ('2011','2012',etc).
what should I do?
is there are any documentation that I can read?
Thank You for your kind response.
add legend
how can i add legend into diffenent div with id? by default legend show in main div
or i need manually add new div for legend?
Hovering...
Hi,
thanks a lot for your time saver extensions, but I have a question.
I can't manage how to show labels on hovering points in a line graph. My code is:
$this->widget('ext.EFlot.EFlotGraphWidget',
                    array(
                        'data'=>$weekly,
                        'options'=>array(
                                'legend'=>array('position'=>'ne','show'=>true,),
                                'xaxis'=> array('mode'=> "time", 'axisLabel'=> 'Settimana','timeformat'=>'%d-%m-%y'),
                                'grid'=>array('borderWidth'=>null,'clickable'=> true,'hoverable'=> true)
                            ),
                        'htmlOptions'=>array('style'=>'width:100%;height:300px;')
                    )
                );
The graph is hoverable as it change a bit while hovering a point, but it doesn't show any label. How can I make this happen?
Flot Update & Add Flot Plugins
Hi there
Do you plan on updating this plugin and maybe include some flot plugins ?
Thanks
Maintaining EFlot
Hi Arthur (and others),
No sorry, I was not really planning on maintaining it, I just wrote it because I needed it and it
did what I wanted it to do. I posted it so others could use it or change it according to their needs. Feel free to change or add to it!
If I would have the time….. but then I also need to eat :)
Greetings,
Michiel
Yii 2
Dear community.
Now Flot Charts Extension is available for Yii 2
http://www.yiiframework.com/extension/yii2-flot-charts/
If you have any questions, please ask in the forum instead.
Signup or Login in order to comment.